A Global Community-Based Training Program#
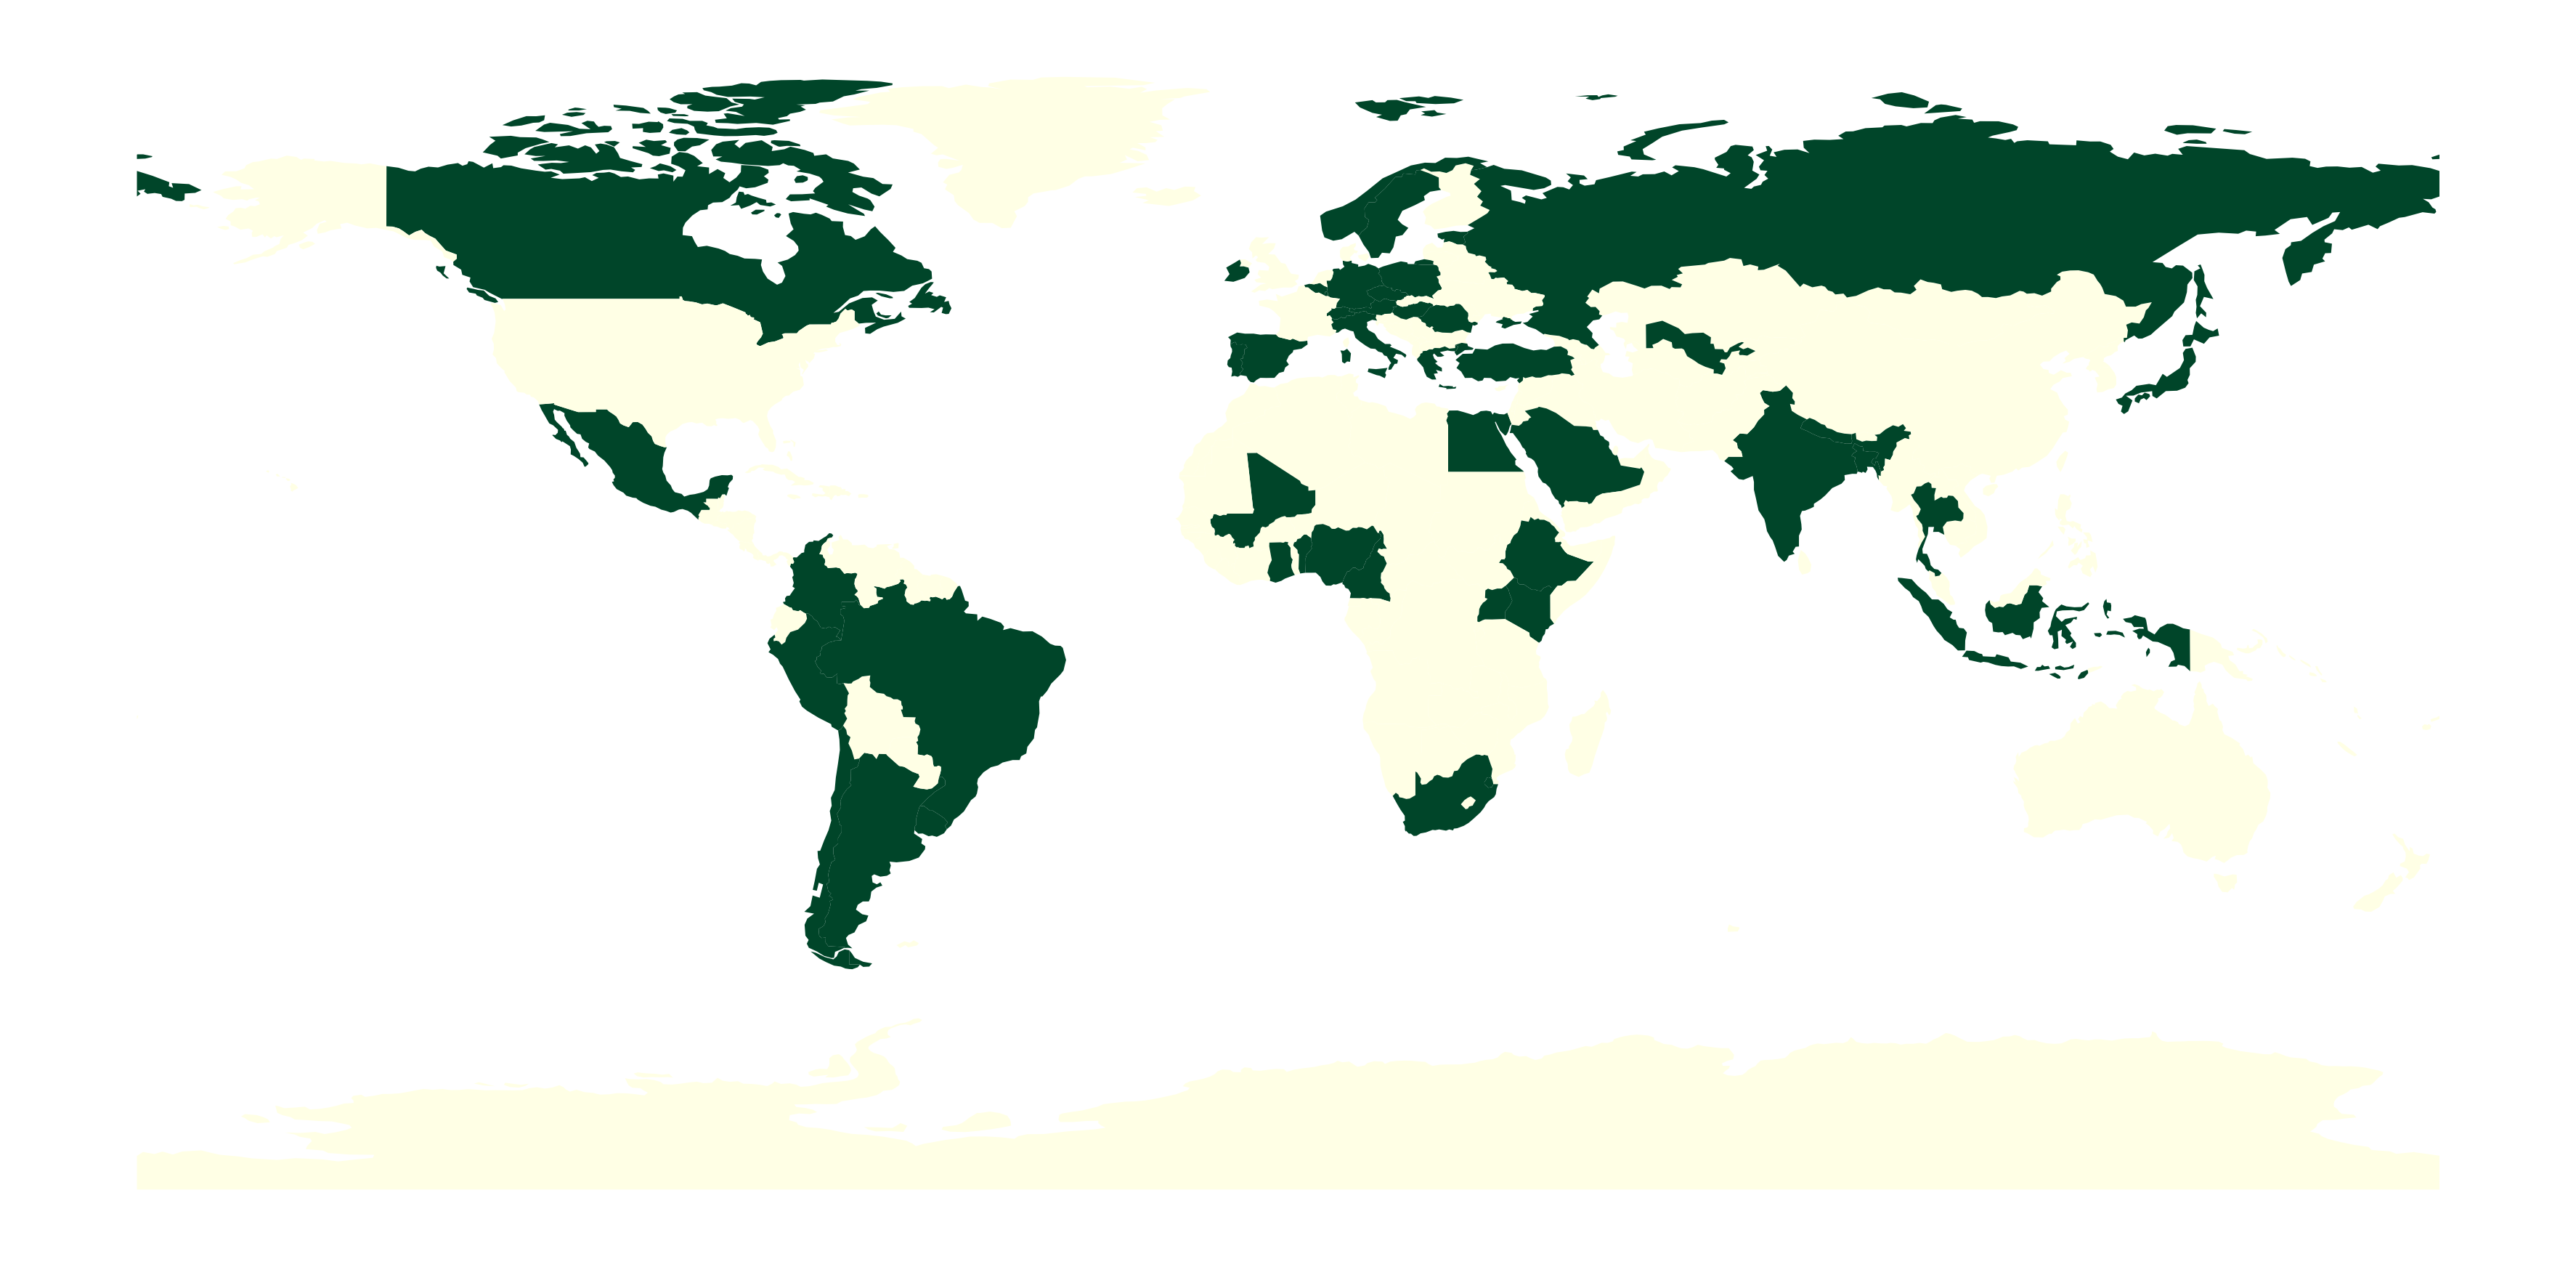
From 2020 until 2024, 8 cohorts (2 per year) have been delivered, reaching 386 mentees from 6 continents, across 55 low- and middle- (LMIC), and high-income countries (HIC). Each cohort has supported an average of 29.75 projects (median = 30.5, min = 20, max = 37; from 8 cohorts), with some projects led individually and some co-developed by groups. Overall, 238 projects, each led by either individuals or teams of collaborators (median of 1.75 mentees per group project). The projects cover various topics (500+ provided keywords) with Community, Open Science, Training and Education, Open source, Reproducibility, Data Science, Machine Learning, Bioinformatics, and AI in the top 10 areas of interest. 79% of the projects graduated (94% during a collaboration). From the projects who did not graduated, 1 project came back in 4 cohorts before graduated, .. disqualified, … finished the program but did not attend graduation call, … did not attend graduation call, … did not engage, … did not finished because of personal circumstances beyond their control, … requested to discontinue.
import geopandas
import matplotlib.pyplot as plt
import pandas as pd
from pathlib import Path
import plotly.graph_objects as go
from wordcloud import WordCloud
cohort_nb = 9
people_df = pd.read_csv(Path("../data/people.csv"), index_col=0).fillna("")
roles_df = {}
roles = []
for r in ["role", "participant", "mentor", "expert", "speaker", "facilitator", "organizer"]:
    role = r.capitalize()
    roles.append(role)
    roles_df[role] = pd.read_csv(Path(f"../data/roles/{r}.csv"), index_col=0)
project_df = (
    pd.read_csv(Path("../data/projects.csv"), index_col=0, na_filter=False)
    .assign(
        participants=lambda df: df.participants.str.split(", "),
        participantNb=lambda df: df.participants.str.len(),
        mentors=lambda df: df.mentors.str.split(", "),
        keywords=lambda df: df.keywords.str.split(", "),
        cohort=lambda df: "OLS-" + df.cohort.astype(str),
    )
)
Cohort stats#
red_roles = ["Participant", "Mentor", "Facilitator", "Speaker", "Expert"]
role_count_df = pd.DataFrame(columns = red_roles)
for r in red_roles:
    role_count_df[r] = (
        roles_df[r]
        .drop(columns = ["city", "country", "country_3", "first-name", "last-name", "pronouns", "continent", "longitude", "latitude"])
        .count(axis=0)
        .rename(index=str.upper)
    )
    role_count_df.loc["Total", r] = len(roles_df[r])
role_count_df = role_count_df.astype("int64")
role_count_df
| Participant | Mentor | Facilitator | Speaker | Expert | |
|---|---|---|---|---|---|
| OLS-1 | 29 | 20 | 0 | 18 | 37 |
| OLS-2 | 52 | 36 | 0 | 24 | 65 |
| OLS-3 | 66 | 34 | 1 | 22 | 63 |
| OLS-4 | 34 | 32 | 7 | 18 | 46 |
| OLS-5 | 71 | 35 | 5 | 17 | 26 |
| OLS-6 | 41 | 32 | 7 | 19 | 39 |
| OLS-7 | 54 | 34 | 10 | 18 | 4 |
| OLS-8 | 69 | 38 | 15 | 12 | 22 |
| Total | 386 | 138 | 30 | 99 | 170 |
Development path of people in the different roles and Alumni#
cohorts = [x.lower() for x in list(role_count_df.index)]
labels = [x.lower() for x in red_roles] + ["alumni"]
role_flow_df = pd.DataFrame({
    "source": [l for subl in [[l]*len(labels) for l in labels] for l in subl],
    "target": labels*len(labels),
    "value": 0
})

for index, row in role_flow_df.iterrows():
    if row.source == "alumni":
        continue
    elif row.target == "alumni":
        for i in range(len(cohorts)-2):
            source = f"{cohorts[i]}-{row.source}"
            # build query with any role in the cohort and no role after in the following cohort
            query = f"`{source}` != ''"
            for r in red_roles:
                target = f"{cohorts[i+1]}-{r.lower()}"
                query += f"and `{target}` == ''"
            role_flow_df.at[index, "value"] += len(people_df.query(query))
    else:
        for i in range(len(cohorts)-2):
            source = f"{cohorts[i]}-{row.source}"
            target = f"{cohorts[i+1]}-{row.target}"
            # build query the source role for a cohort and target role for the following cohort
            query = f"`{source}` != '' and `{target}` != ''"
            query_res = people_df.query(query)
            # check for each result how many roles in cohort and following cohort to normalize the value
            value = 0
            for q_i, q_r in query_res.iterrows():
                new_role_nb = len(q_r[f"{cohorts[i+1]}-role"].split(","))
                value += 1/(new_role_nb)
            role_flow_df.at[index, "value"] += value
/tmp/ipykernel_1974/1411840461.py:33: FutureWarning: Setting an item of incompatible dtype is deprecated and will raise an error in a future version of pandas. Value '3.333333333333333' has dtype incompatible with int64, please explicitly cast to a compatible dtype first.
  role_flow_df.at[index, "value"] += value
colors = {
    "participant": "#3182bd",
    "mentor": "#fd8d3c",
    "expert": "#d9d9d9",
    "speaker": "#dadaeb",
    "facilitator": "#a1d99b",
    "alumni": "grey"
}
label_df = pd.DataFrame({
    "labels": [l.capitalize() for l in labels] * 2,
    "colors": [colors[l] for l in labels] * 2,
    "x": [0.1]*len(labels)+[0.9]*len(labels),
    "y": [0.1]*(len(labels)*2)})

fig = go.Figure(data=[go.Sankey(
    arrangement="snap",
    node = dict(
        pad = 15,
        thickness = 20,
        line = dict(color = "black", width = 0.5),
        label = label_df.labels,
        color = label_df.colors,
    ),
    link = dict(
      source = [labels.index(e) for e in role_flow_df.source],
      target = [labels.index(e)+len(labels) for e in role_flow_df.target],
      value = role_flow_df.value
  ))])

fig.update_layout(
    font_size=18,
    width=800,
    height=400,
    margin=go.layout.Margin(
        l=10, #left margin
        r=10, #right margin
        b=20, #bottom margin
        t=20, #top margin
    )
)

fig.show()
fig.write_image("images/flow.png")
---------------------------------------------------------------------------
FileNotFoundError                         Traceback (most recent call last)
Cell In[8], line 43
     30 fig.update_layout(
     31     font_size=18,
     32     width=800,
   (...)
     39     )
     40 )
     42 fig.show()
---> 43 fig.write_image("images/flow.png")

File /usr/share/miniconda/envs/open-seeds-paper-2024/lib/python3.12/site-packages/plotly/basedatatypes.py:3835, in BaseFigure.write_image(self, *args, **kwargs)
   3775 """
   3776 Convert a figure to a static image and write it to a file or writeable
   3777 object
   (...)
   3831 None
   3832 """
   3833 import plotly.io as pio
-> 3835 return pio.write_image(self, *args, **kwargs)

File /usr/share/miniconda/envs/open-seeds-paper-2024/lib/python3.12/site-packages/plotly/io/_kaleido.py:296, in write_image(fig, file, format, scale, width, height, validate, engine)
    286         raise ValueError(
    287             """
    288 The 'file' argument '{file}' is not a string, pathlib.Path object, or file descriptor.
   (...)
    291             )
    292         )
    293     else:
    294         # We previously succeeded in interpreting `file` as a pathlib object.
    295         # Now we can use `write_bytes()`.
--> 296         path.write_bytes(img_data)

File /usr/share/miniconda/envs/open-seeds-paper-2024/lib/python3.12/pathlib.py:1036, in Path.write_bytes(self, data)
   1034 # type-check for the buffer interface before truncating the file
   1035 view = memoryview(data)
-> 1036 with self.open(mode='wb') as f:
   1037     return f.write(view)

File /usr/share/miniconda/envs/open-seeds-paper-2024/lib/python3.12/pathlib.py:1013, in Path.open(self, mode, buffering, encoding, errors, newline)
   1011 if "b" not in mode:
   1012     encoding = io.text_encoding(encoding)
-> 1013 return io.open(self, mode, buffering, encoding, errors, newline)

FileNotFoundError: [Errno 2] No such file or directory: 'images/flow.png'
Participants re-joining (%)
role = "participant"
role_nb = float(role_flow_df.query(f"source == '{ role }'").value.sum())
role_wo_alumni = float(role_flow_df.query(f"source == '{ role }' and target != 'alumni'").value.sum())
100 * role_wo_alumni  / role_nb
26.153846153846153
Mentors re-joining (%)
role = "mentor"
role_nb = float(role_flow_df.query(f"source == '{ role }'").value.sum())
role_wo_alumni = float(role_flow_df.query(f"source == '{ role }' and target != 'alumni'").value.sum())
100 * role_wo_alumni  / role_nb
57.53238436562595
People location#
map_fp = Path("../data/naturalearth_lowres/naturalearth_lowres.shp")
world_df = geopandas.read_file(map_fp).rename(columns = {"SOV_A3": "iso_a3"})
country_code_df = (roles_df["Role"].groupby(["country_3"]).count()
    .rename(columns = {"country": "total"})
    .drop(columns = ["city", "first-name", "last-name", "pronouns", "continent", "longitude", "latitude"])
)
Number of countries:
len(country_code_df)
55
country_code_df[country_code_df != 0] = 1
country_code_df = (country_code_df
    .rename_axis("iso_a3")
    .reset_index()
)
country_world_df = pd.merge(world_df, country_code_df, on='iso_a3', how='outer')
country_world_df['total'] = country_world_df['total'].fillna(0)
for i in range(1, cohort_nb):
    country_world_df[f'ols-{i}'] = country_world_df[f'ols-{i}'].fillna(0)
fig, ax = plt.subplots(figsize=(15, 10), dpi=300)

country_world_df.plot(
    column='total',
    ax=ax,
    legend=False,
    cmap='YlGn')
ax.set_axis_off()
Projects#
Number of projects over all cohorts
len(project_df)
238
cohort_df = (
    project_df
    .groupby(by="cohort")
    .count()
    .drop(columns = ["participants", "mentors", "description", "keywords", "status", "collaboration", "participantNb"])
    .rename(columns = {"name": "Total"})
)
Aggregating statistic of number of projects per cohort
cohort_df.Total.describe()
count     8.000000
mean     29.750000
std       5.391793
min      20.000000
25%      26.750000
50%      30.500000
75%      33.250000
max      37.000000
Name: Total, dtype: float64
Mean number of projects per cohort
cohort_df.Total.median()
np.float64(30.5)
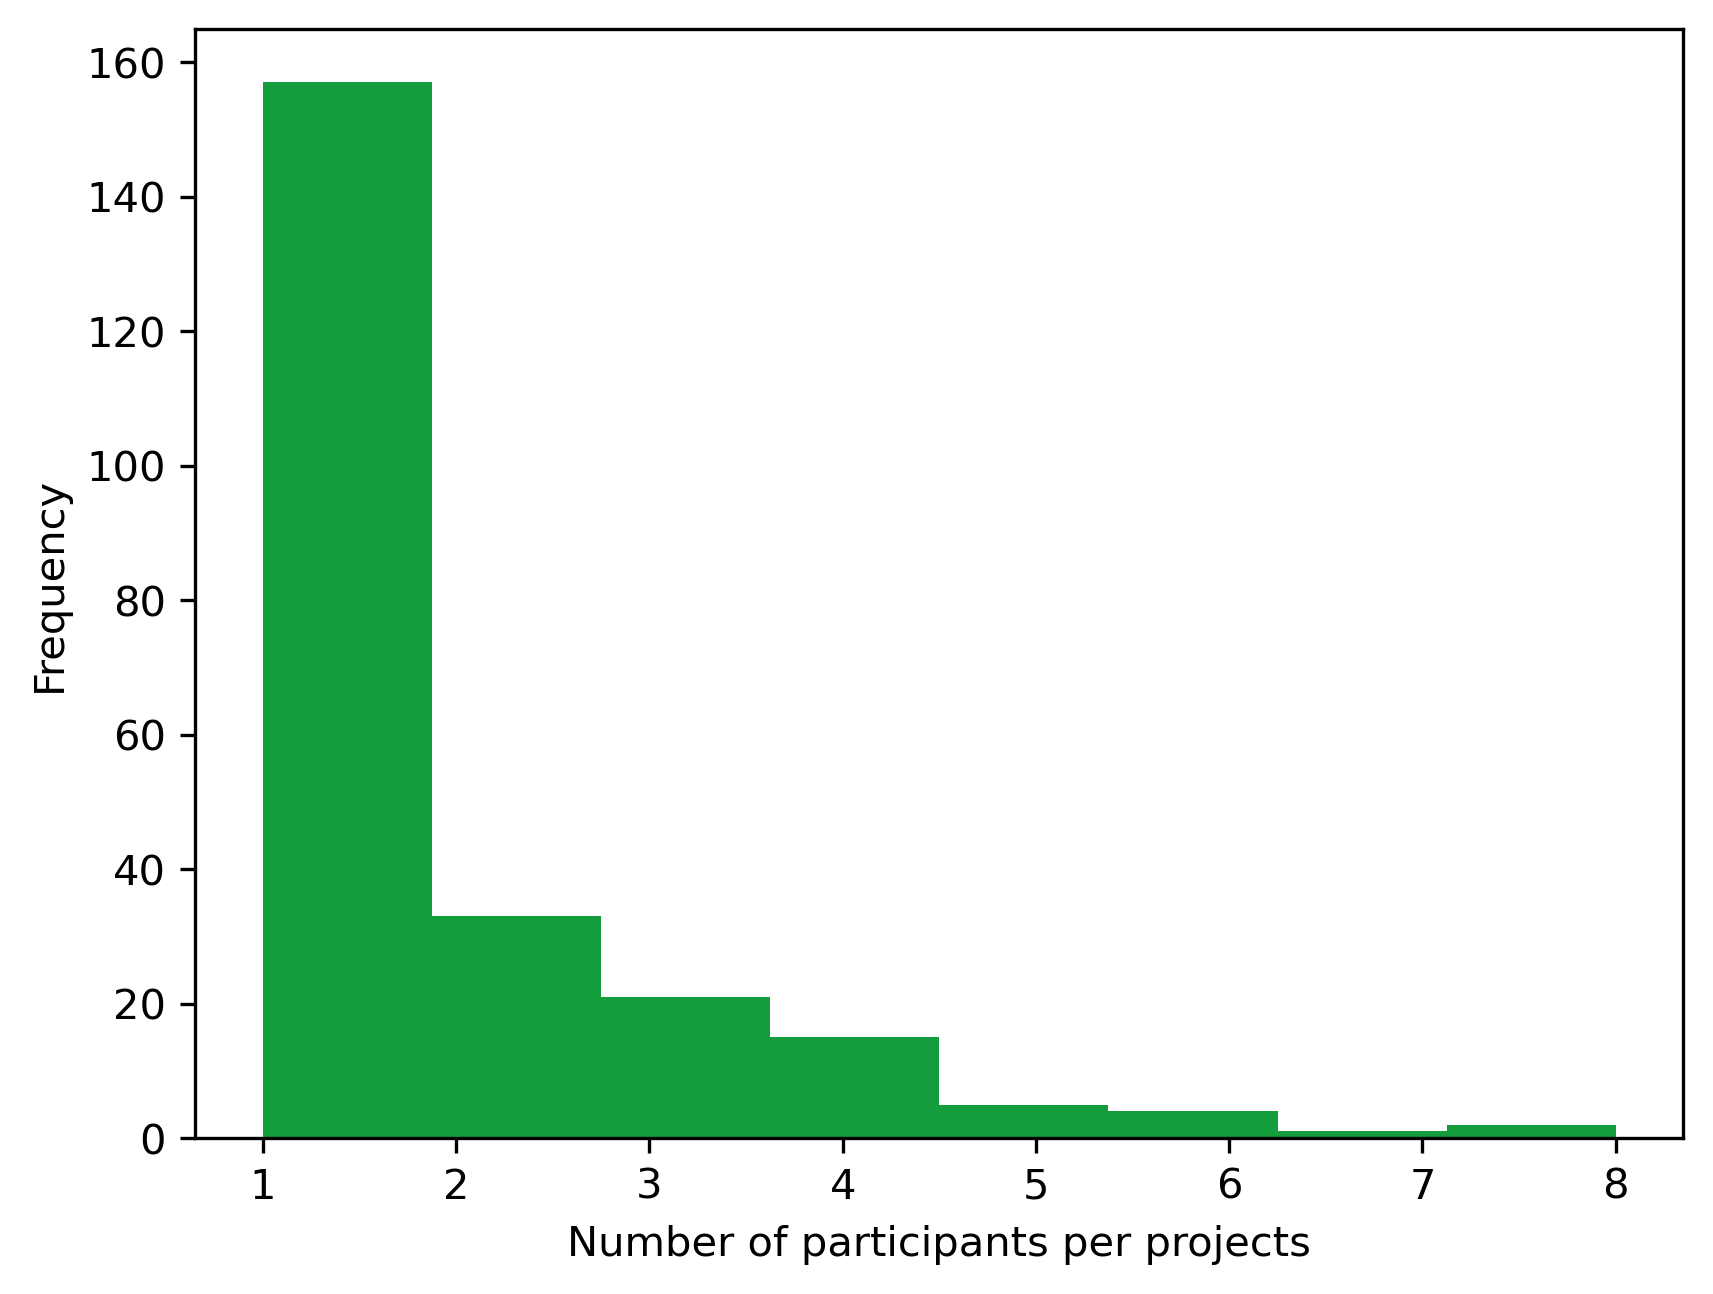
Participants#
Aggregating statistic of the number of participants per projects
project_df.participantNb.describe()
count    238.000000
mean       1.756303
std        1.346766
min        1.000000
25%        1.000000
50%        1.000000
75%        2.000000
max        8.000000
Name: participantNb, dtype: float64
fig, ax = plt.subplots(dpi=300)
project_df.participantNb.plot.hist(
    bins=8, ax=ax, legend=False, color="#139D3D"
)
plt.xlabel('Number of participants per projects')
Text(0.5, 0, 'Number of participants per projects')
Keywords#
Number of keywords
keyword_df = (project_df
    .drop(columns = ["participantNb", "participants", "mentors", "description", "status", "cohort", "collaboration", "status", "graduation"])
    .explode("keywords")
    .assign(keywords=lambda df: df.keywords.str.capitalize())
    .replace("Community building", "Community")
    .replace("Research community", "Community")
    .replace("Ethics of ai", "Ethical AI")
    .replace("Ethical ai", "Ethical AI")
    .replace("Enviromental", "Environmental science")
    .replace("Equal opportunity", "Equality")
    .replace("Training", "Training and education")
    .replace("Education", "Training and education")
    .replace("Artificial intelligence", "AI")
    .replace("Ai", "AI")
    .replace("Fair", "FAIR")
    .replace("Open-source", "Open source")
    .replace("Open source software", "Open source")
    .replace("Opensource", "Open source")
    .replace("Os", "Open source")
    .replace("Open source projects", "Open source")
    .replace(" data science", "Data science")
    .replace("Visualisation", "Data visualisation")
    .replace("Next-generation sequencing", "Sequencing")
    .replace("Open educational resource", "Open education")
    .replace("Reproducible research", "Reproducibility")
    .replace("Data", "Data science")
    .replace("Open community", "Community")
    .groupby(by="keywords")
    .count()
    .rename(columns={"name": "Frequency"})
    .sort_values("Frequency", ascending=False)
)
len(keyword_df)
588
Top 10 of keywords by frequency
frec = keyword_df.Frequency.to_dict()
frec.head()
---------------------------------------------------------------------------
AttributeError                            Traceback (most recent call last)
Cell In[23], line 2
      1 frec = keyword_df.Frequency.to_dict()
----> 2 frec.head()

AttributeError: 'dict' object has no attribute 'head'
frec = keyword_df.Frequency.to_dict()

wc = WordCloud(
    background_color="rgba(255, 255, 255, 0)",
    random_state=42,
    width=800,
    height=400,
)

wordcloud = wc.generate_from_frequencies(frec)

fig, ax = plt.subplots(dpi=300)
ax.imshow(wc, interpolation='nearest')
ax.set_axis_off()
Graduation stats#
Percentage of graduated project
100 * len(project_df.query('status == "graduated"'))/len(project_df.status)
Percentage of graduated project within collaboration
100 * len(project_df.query('status == "graduated" and collaboration != ""'))/len(project_df.query('collaboration != ""'))
Projects that did not graduated
non_graduated_project = (
    project_df.query('status != "graduated"')
    .drop(columns=["description", "keywords", "status", "graduation", "collaboration", "participantNb"])
)
non_graduated_project["participants"] = non_graduated_project["participants"].apply(lambda x: ", ".join(str(i) for i in x))
non_graduated_project["mentors"] = non_graduated_project["mentors"].apply(lambda x: ", ".join(str(i) for i in x))
#non_graduated_project.to_csv("../results/openseeds/non_graduated_project.csv", sep="\t", index=False)
Project that did graduated but came back
len(project_df[project_df.name.duplicated(keep=False)]["name"].unique())
Overview figure#
fig, axs = plt.subplots(nrows=2, ncols=2, dpi=300)#
#gs = fig.add_gridspec(2,2) ax1 = axs[0, 0] ax2 = axs[0, 1]#fig.add_subplot(gs[1, :]) ax3 = axs[1, 0]#fig.add_subplot(gs[2, 0]) ax4 = axs[1, 1]#fig.add_subplot(gs[2, 1])
A#
country_world_df.plot( column=’total’, ax=ax1, legend=False, cmap=’YlGn’, figsize=(20, 10)) ax1.set_axis_off() ax1.text(-0.1, 1.1, “A”, transform=ax1.transAxes, size=20, weight=’bold’)
B#
with open(“images/flow.png”, “rb”) as f: image=plt.imread(f) ax2.imshow(image) ax2.set_axis_off() ax2.text(-0.1, 1.1, “B”, transform=ax2.transAxes, size=20, weight=’bold’)
c#
ax3.imshow(wc, interpolation=’nearest’) ax3.set_axis_off() ax3.text(-0.1, 1.1, “C”, transform=ax3.transAxes, size=20, weight=’bold’)
D#
project_df.participantNb.plot.hist( bins=8, ax=ax4, legend=False, color=”#139D3D”, figsize=(20, 10) ) ax4.set_xlabel(“Number of participants per project”) ax4.set_ylabel(“Frequency”) ax4.text(-0.1, 1.1, “D”, transform=ax4.transAxes, size=20, weight=’bold’)
fig.tight_layout() fig.savefig(Path(“../figures/figure-3-based_training_program.png”), bbox_inches=’tight’)