Overview of Microgrant and Honoraria Process#
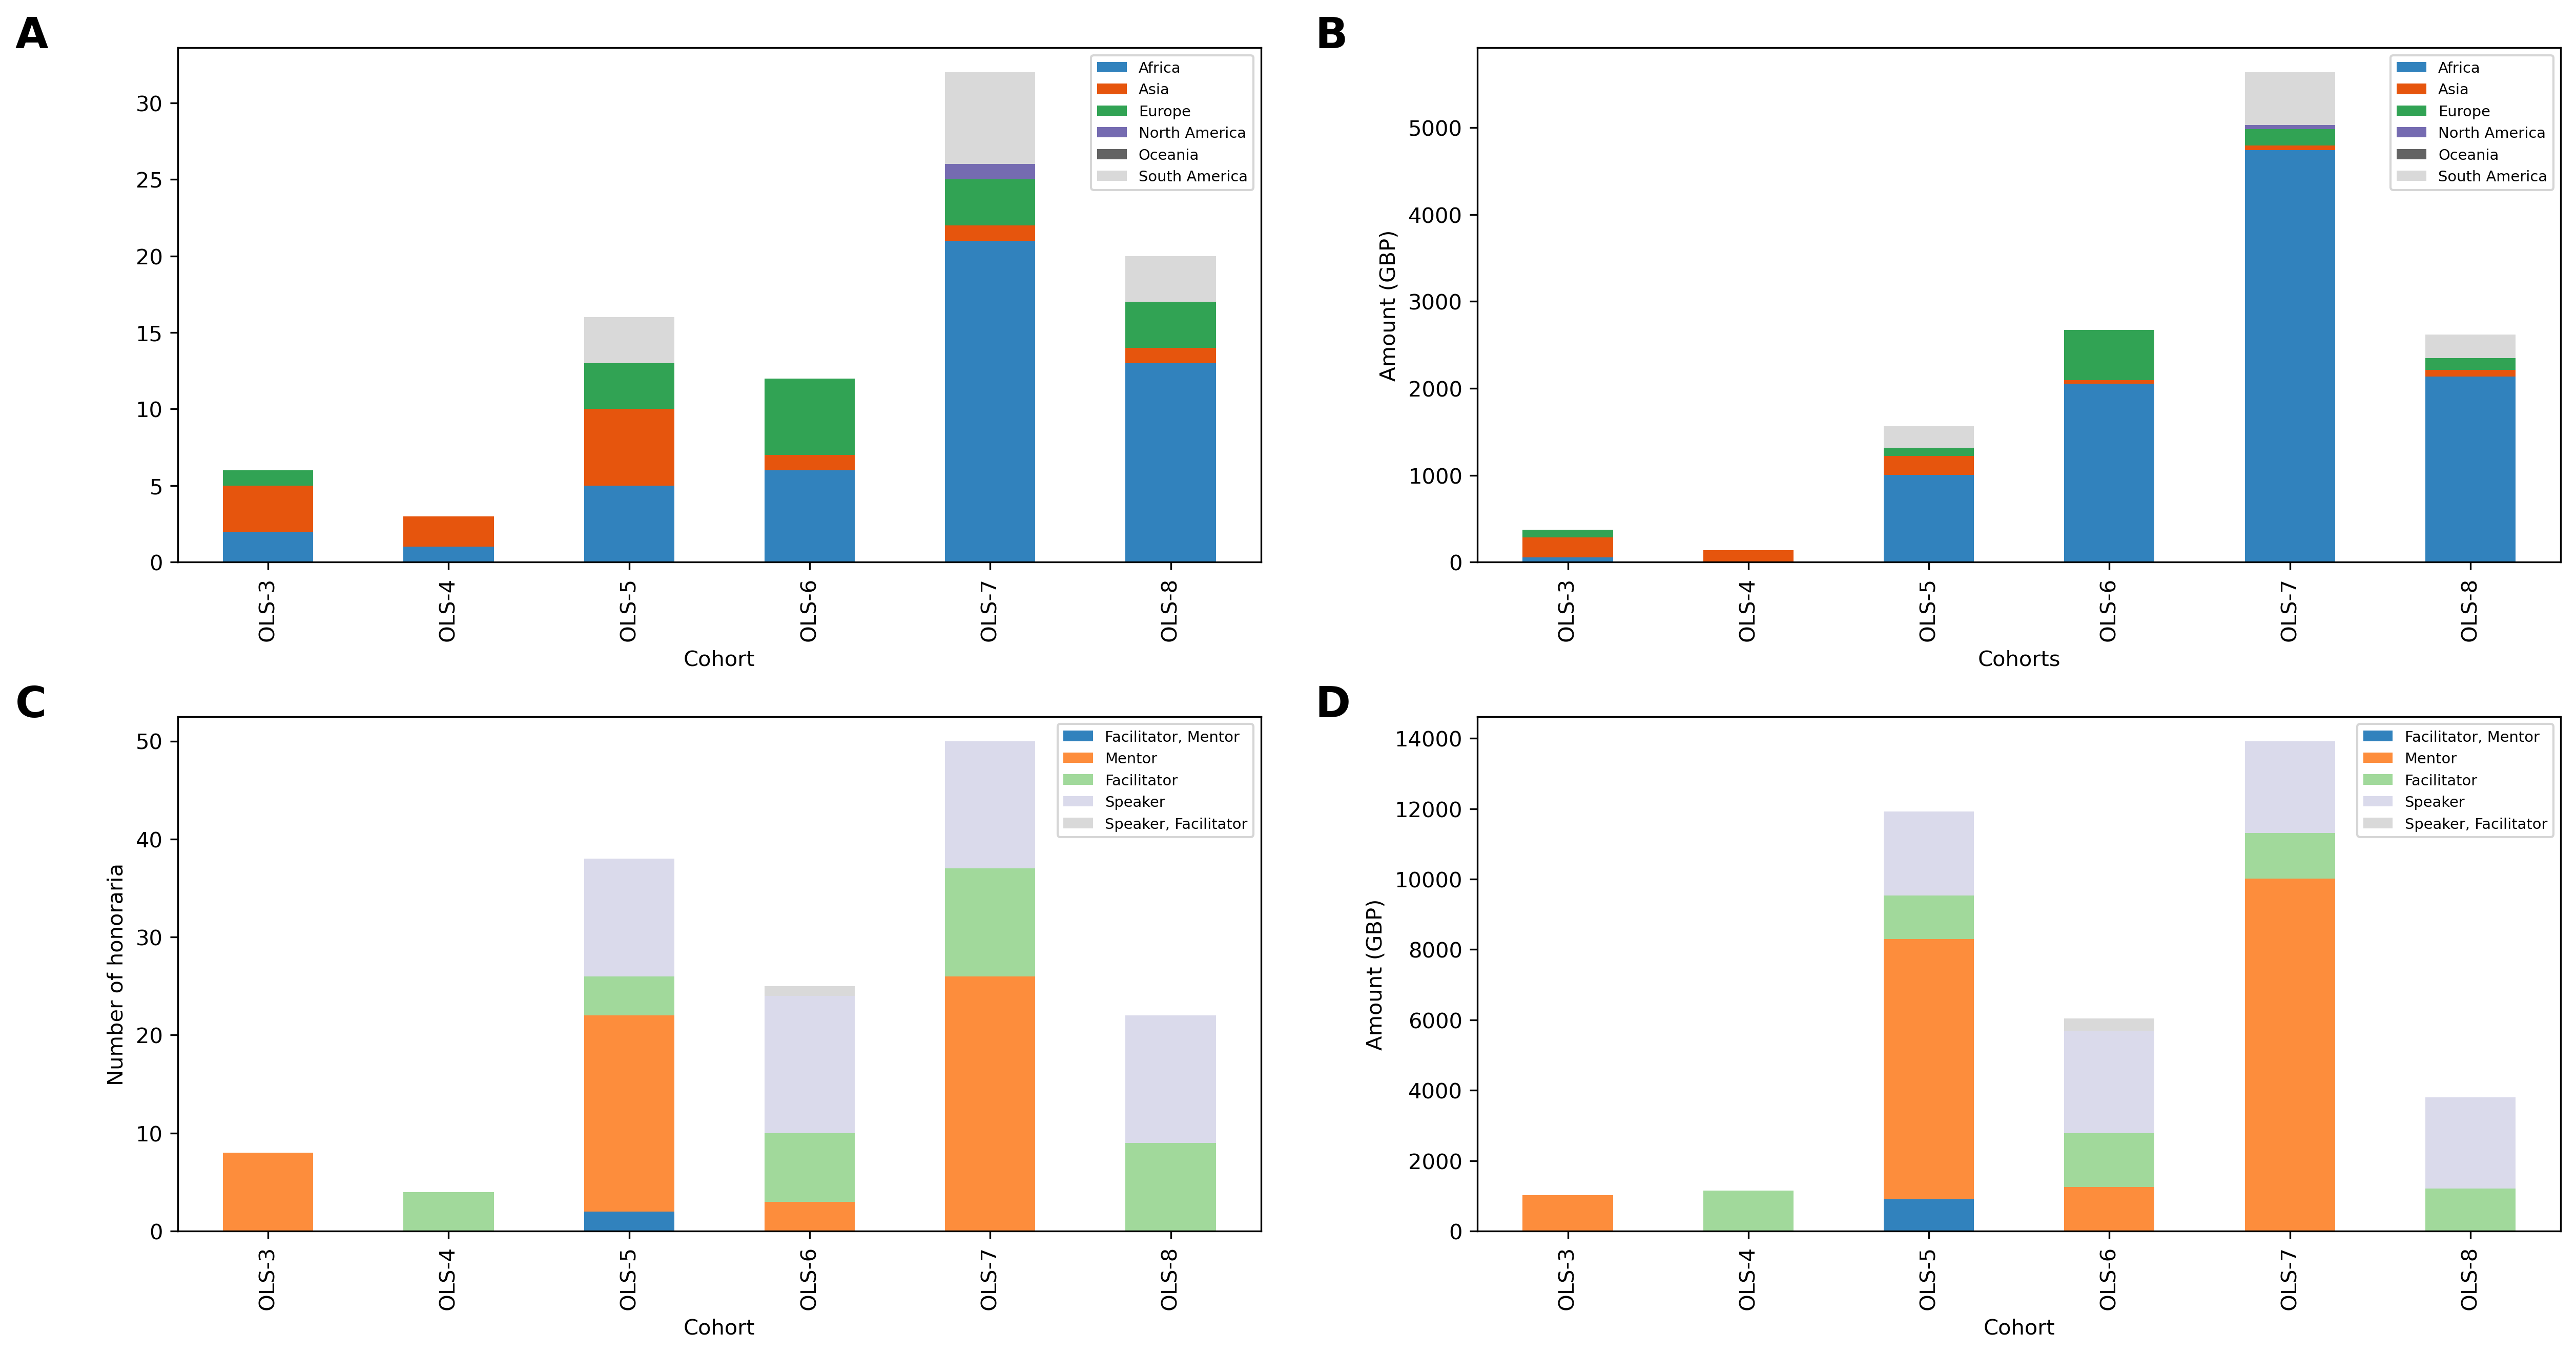
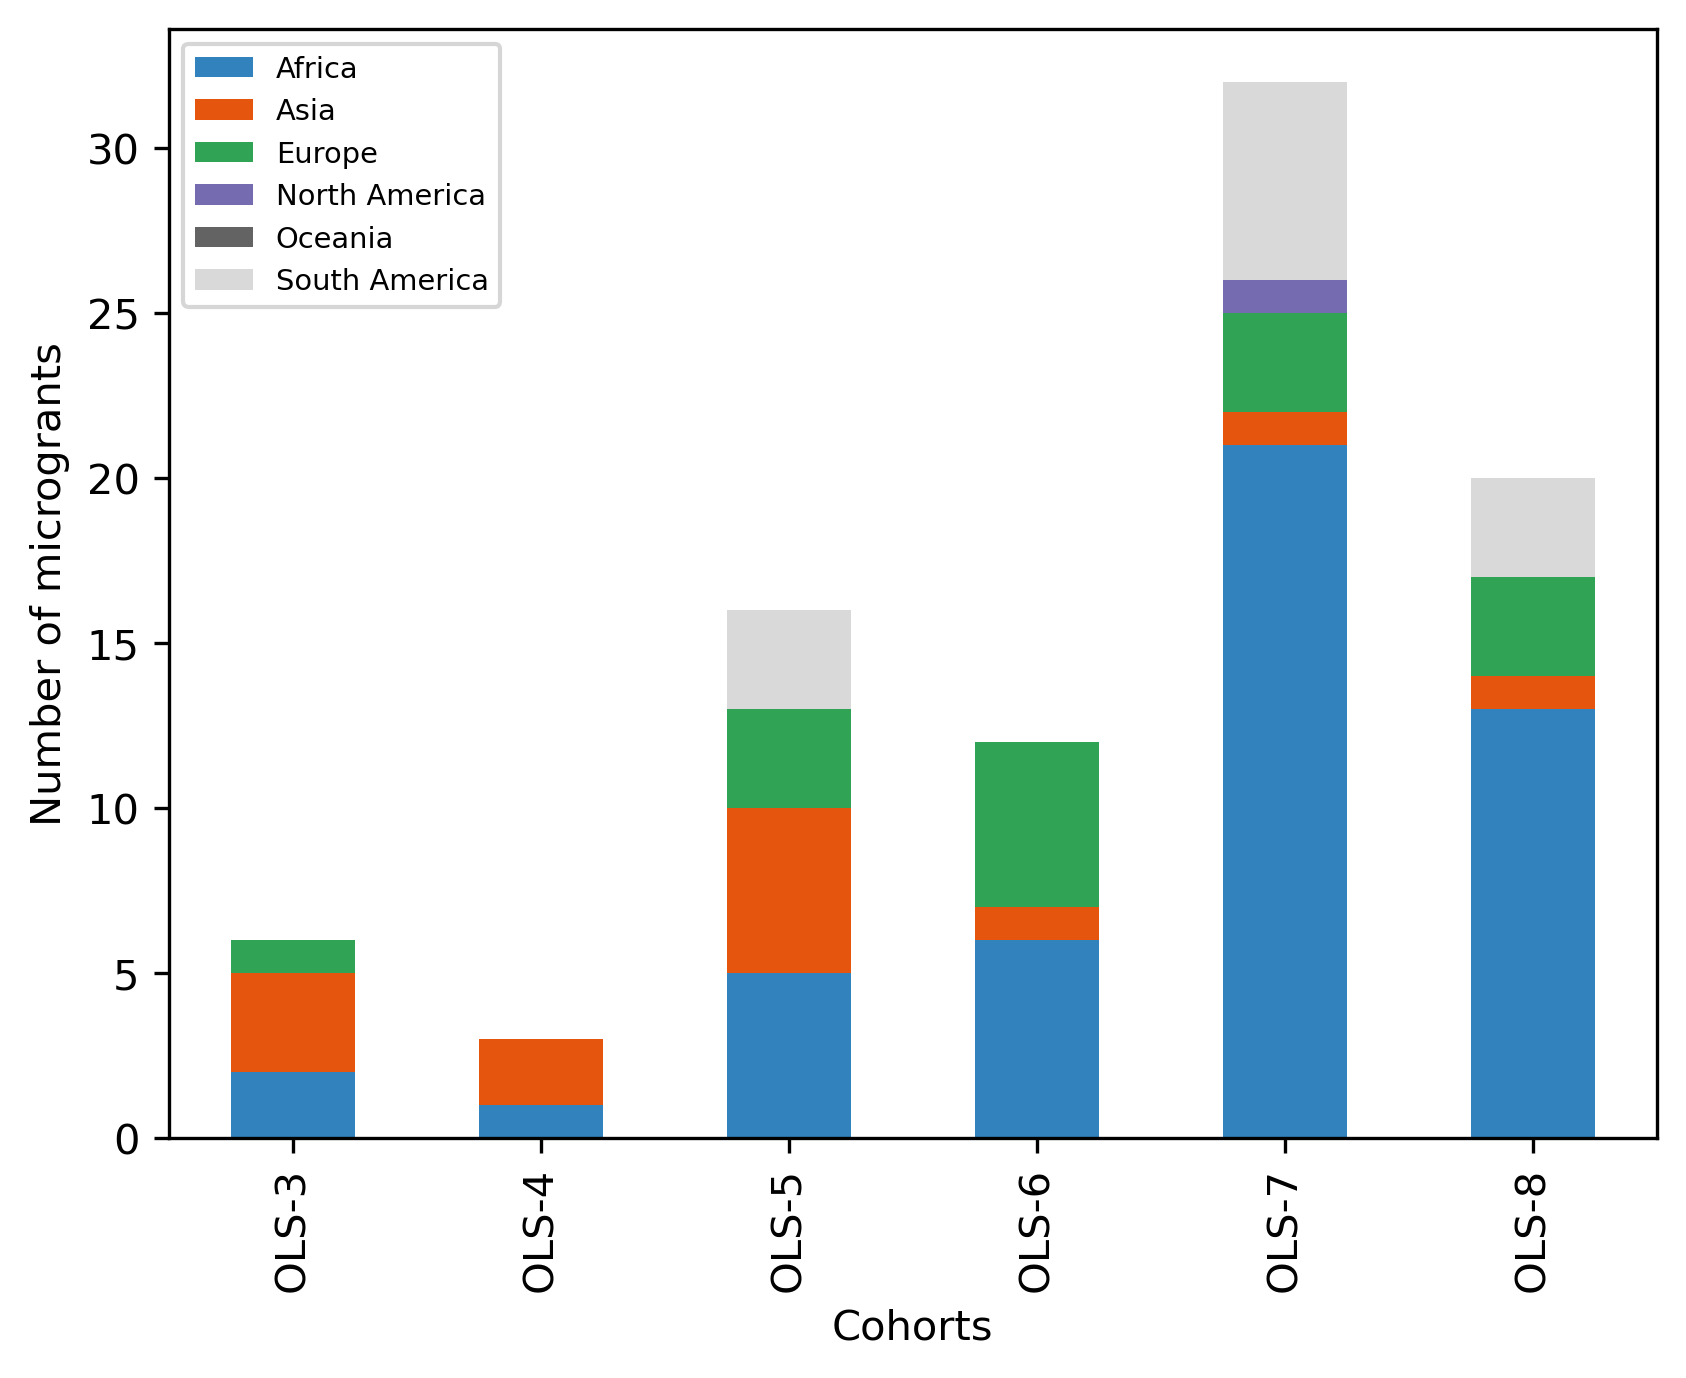
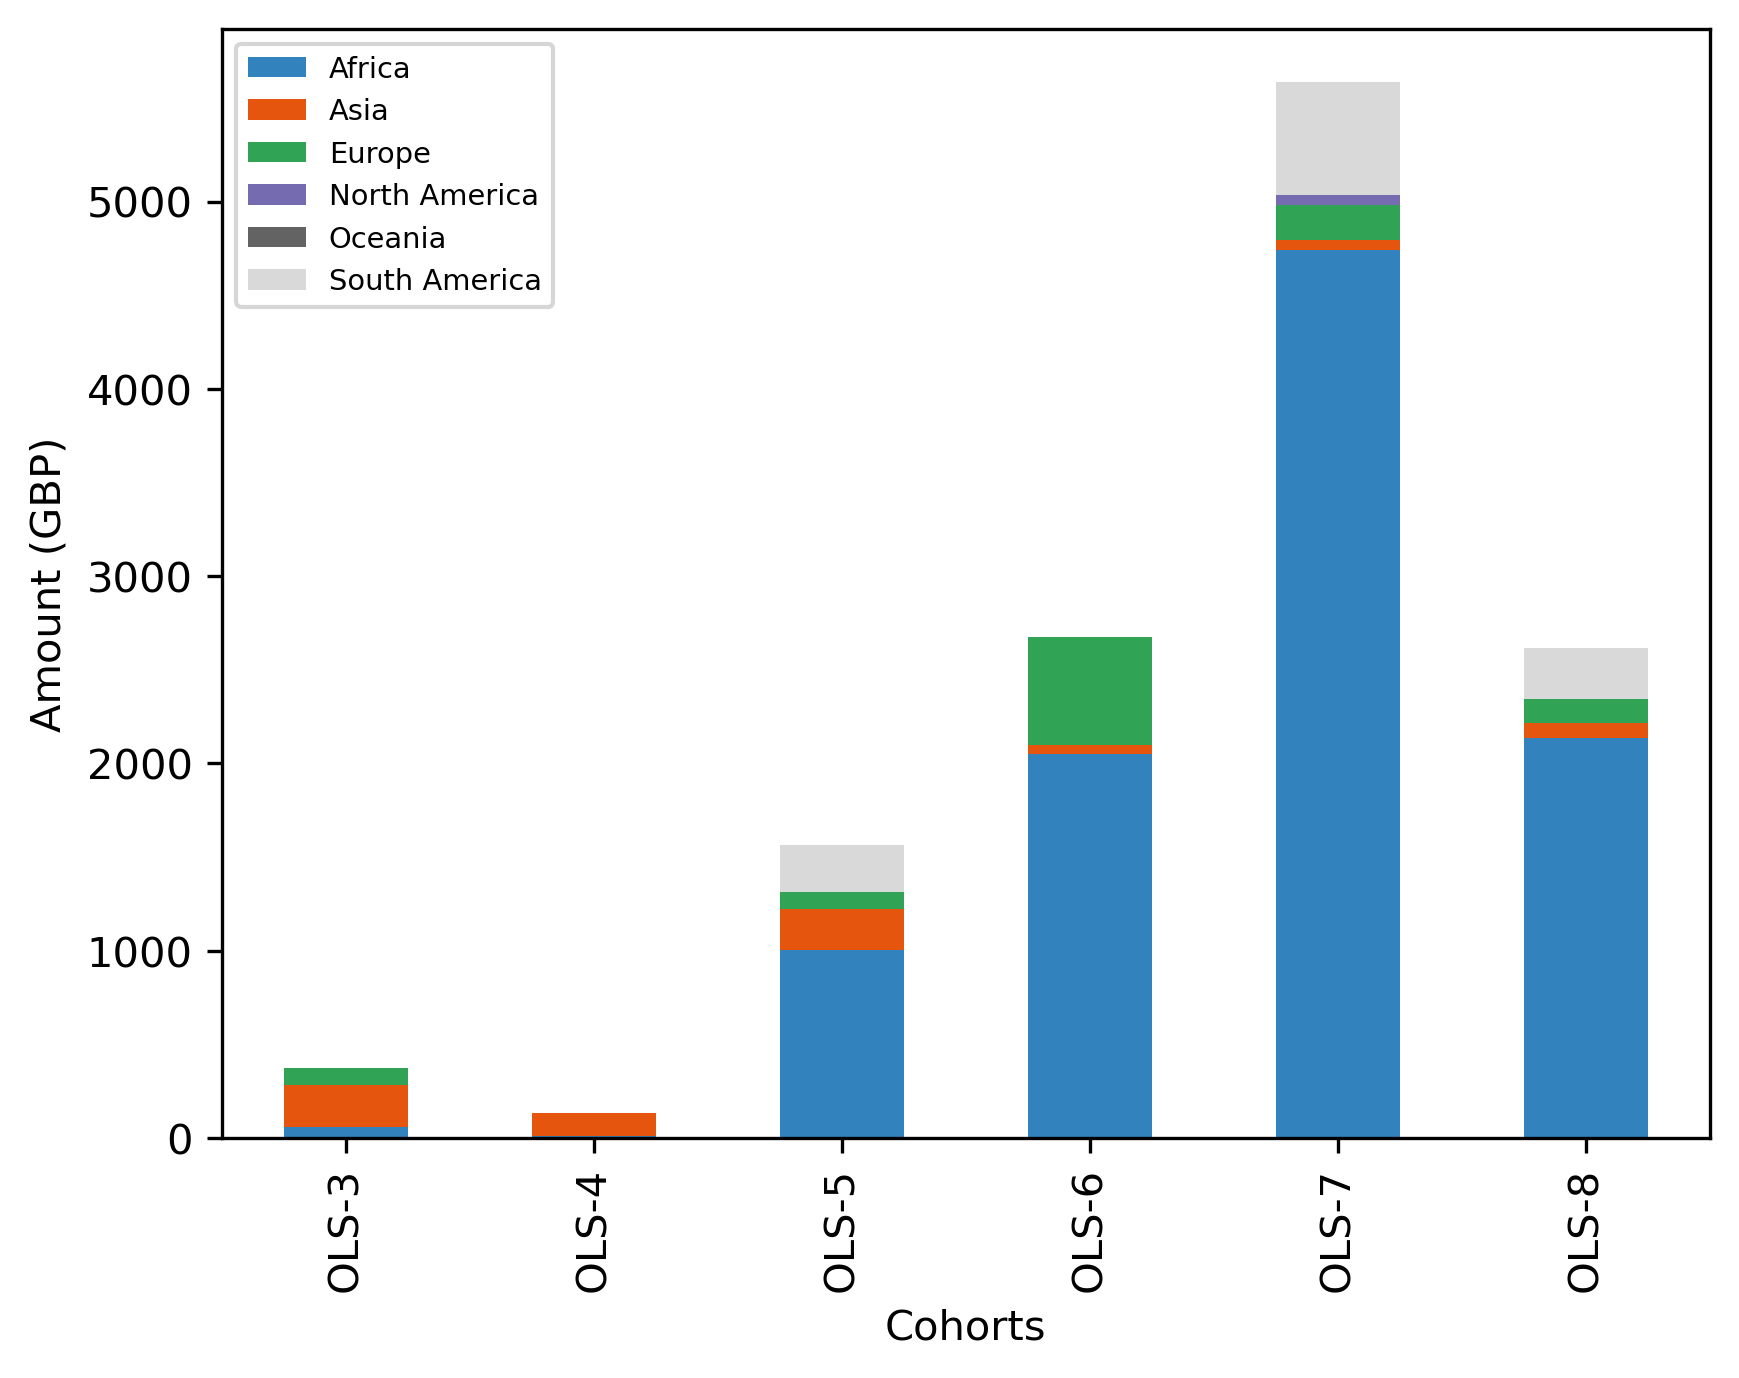
To facilitate participation, 89 microgrants have been granted since the third cohort to participants across 23 countries from five continents. The grants range from 5 GBP to 1,020 GBP with a mean request value of 147 GBP. A large proportion of the budget is reserved for participants in LMIC countries. Requests included expenses for electronic items (Headset, Webcam, Battery, Mouse, Modem, Hard Drive, Keyboard - from the most to least requested), internet and caring responsibility costs.
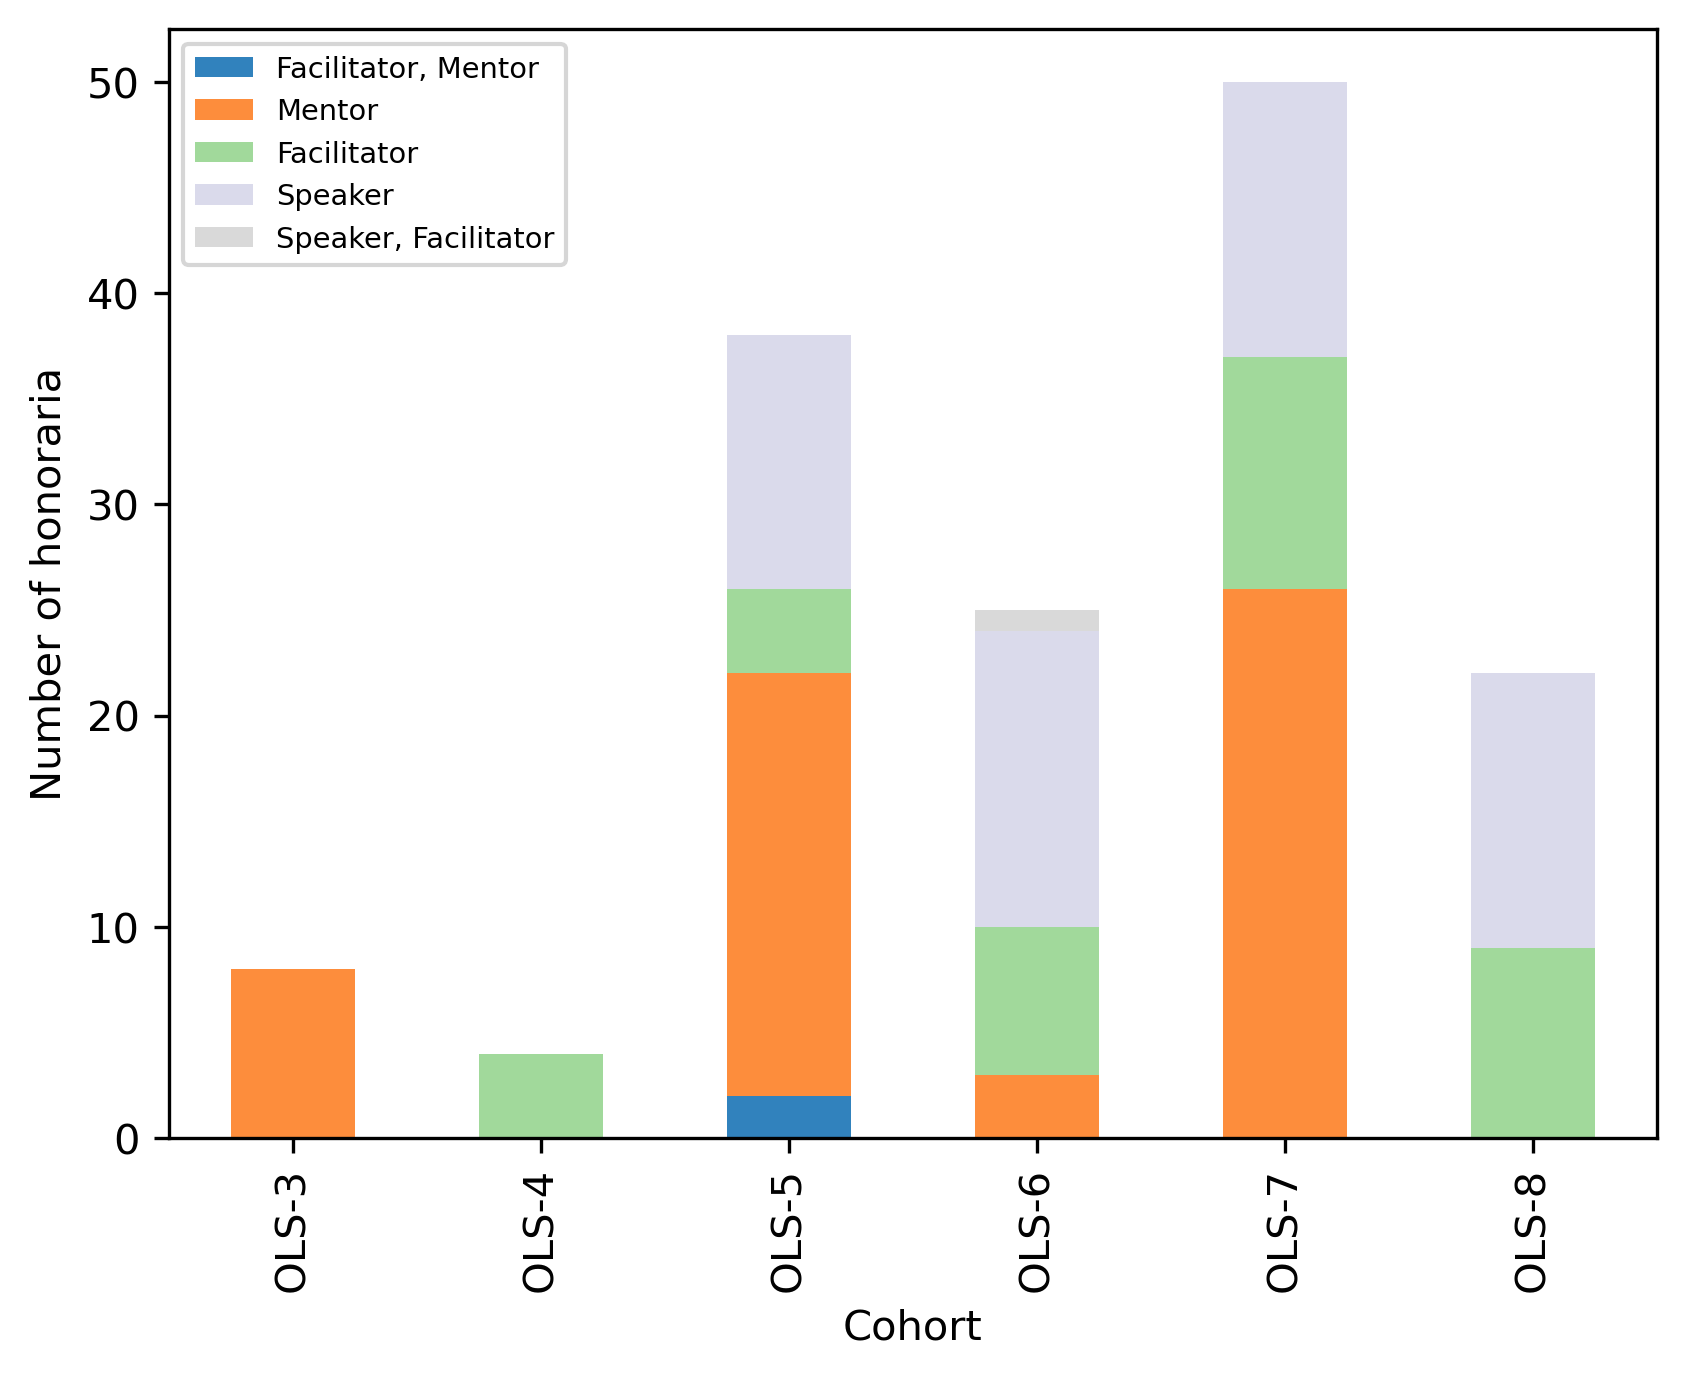
The cohorts also involved 130+ mentors, 90+ speakers, 170+ experts, and 30+ facilitators from 6 continents. Since the third cohort, 135 honoraria were provided to mentors, facilitators, and speakers for 35,700 GBP with an average of 264 GBP per honorarium.
from pathlib import Path
import re

import matplotlib.pyplot as plt
import pandas as pd
import pycountry
import seaborn as sns
import geopandas
country_continent_fp = Path("../data/country_alpha_2_continent.csv")
country_continent_df = (
    pd.read_csv(country_continent_fp, index_col=0)
)
COUNTRY_ALPHA2_TO_CONTINENT = country_continent_df.to_dict()['Continent']

def get_continent(country):
    """
    Get continent

    :param country: name of the country
    """
    py_country = pycountry.countries.get(name=country)
    if py_country is None:
        py_country = pycountry.countries.get(common_name=country)
    if py_country is None:
        return ""
    else:
        if py_country.alpha_2 not in COUNTRY_ALPHA2_TO_CONTINENT:
            return ""
        else:
            return COUNTRY_ALPHA2_TO_CONTINENT[py_country.alpha_2]


def get_country_3(country):
    """
    Get country code

    :param country: name of the country
    """
    py_country = pycountry.countries.get(name=country)
    if py_country is None:
        py_country = pycountry.countries.get(common_name=country)
    if py_country is None:
        return ""
    else:
        return py_country.alpha_3


rate = {
    "GBP": 1,
    "USD": 0.8,
    "EUR": 0.86,
    "INR": 0.0095,
    "XAF": 0.0013,
    "ZAR": 0.042,
    "ARS": 0.0022,
    "": 1
}
Microgrants#
def get_item(item):
    new_item = set()
    if "internet" in item or "Internet" in item or "Data subscription" in item or "mobile data" in item:
        new_item.add("Internet")
    if "Book" in item:
        new_item.add("Book")
    if "microphone" in item or "Microphone" in item or "headset" in item or "Headset" in item or "headphones" in item or "earbuds" in item:
        new_item.add("Headset")
    if "webcam" in item or "Webcam" in item:
        new_item.add("Webcam")
    if "marketing and merchandising expenses" in item:
        new_item.add("Marketing")
    if "childcare" in item or "Childcare" in item:
        new_item.add("Caring")
    if "Mouse" in item:
        new_item.add("Mouse")
    if "modem" in item or "Router" in item:
        new_item.add("Modem")
    if "batteries" in item or "battery" in item or "Powerbank" in item:
        new_item.add("Battery")
    if "keyboard" in item or "Keyboard" in item:
        new_item.add("Keyboard")
    if "new computer" in item or "Dell Latitude" in item:
        new_item.add("Laptop")
    if "Hard disk" in item or "Memory card" in item or "hard drive" in item:
        new_item.add("Hardrive")
    if "chair" in item or "license" in item or "prototype" in item or "Gasoline" in item or "Fuel" in item or "implementation of the project" in item:
        new_item.add("Other")
    return list(new_item)

microg_df = (
    pd.read_csv(Path("../data/microgrants.csv") )
    .fillna("")
    .assign(
        Continent=lambda df: [get_continent(x) for x in df.Country],
        Rate=lambda df: [rate[x] for x in df.Currency],
        Items=lambda df: [get_item(x) for x in df.Item],
    )
    .assign(Cost= lambda df: df.Cost * df.Rate)
    .drop(columns = ["Currency", "Rate", "Item"])
)
Costs#
Aggregating statistic of microgrant costs
microg_df.Cost.describe()
count      89.000000
mean      146.153343
std       170.657150
min         5.600000
25%        42.740500
50%        83.260000
75%       155.790000
max      1020.000000
Name: Cost, dtype: float64
Total amount (in GBP)
sum(microg_df.Cost)
13007.647500000001
Location#
Number of countries
country_code_df = (
    microg_df
    .drop(columns = ["Items", "Cohort", "Continent"])
    .groupby(["Country"])
    .count()
    .rename(columns = {'Cost': 'total'})
    .rename_axis("iso_a3")
    .reset_index()
)
len(country_code_df)
23
microg_cohort_continent_nb_df = (
    microg_df
    .drop(columns = ["Items", "Country"])
    .groupby(by=["Continent", "Cohort"])
    .count()
)
microg_cohort_continent_nb_df = (
    pd.pivot_table(microg_cohort_continent_nb_df, index = 'Continent', columns = 'Cohort', values="Cost")
    .reindex(['Africa', 'Asia', 'Europe', 'North America', 'Oceania', 'South America'])
)

fig, ax = plt.subplots()
fig.set_dpi(300)
(microg_cohort_continent_nb_df
     .transpose()
     .plot.bar(stacked=True, ax=ax, colormap='tab20c'))
plt.xlabel('Cohorts')
plt.ylabel('Number of microgrants')
ax.legend(fontsize='x-small')
<matplotlib.legend.Legend at 0x7fe7f5e562a0>
Amount (GBP) per location#
microg_cohort_continent_amount_df = (
    microg_df
    .drop(columns = ["Items", "Country"])
    .groupby(by=["Continent", "Cohort"])
    .sum()
)
microg_cohort_continent_amount_df = (
    pd.pivot_table(microg_cohort_continent_amount_df, index = 'Continent', columns = 'Cohort', values="Cost")
    .reindex(['Africa', 'Asia', 'Europe', 'North America', 'Oceania', 'South America'])
)

fig, ax = plt.subplots()
fig.set_dpi(300)
(microg_cohort_continent_amount_df
     .transpose()
     .plot.bar(stacked=True, ax=ax, colormap='tab20c'))
plt.xlabel('Cohorts')
plt.ylabel('Amount (GBP)')
ax.legend(fontsize='x-small')
<matplotlib.legend.Legend at 0x7fe7f3867f80>
Items#
item_df = (
    microg_df
    .drop(columns = ["Continent", "Country", "Cost"])
    .explode("Items")
    .groupby(by="Items")
    .count()
    .rename(columns = {"Cohort": "Number"})
    .sort_values('Number')
)
item_df.sort_values("Number", ascending=False).head(10)
| Number | |
|---|---|
| Items | |
| Headset | 50 |
| Internet | 40 |
| Webcam | 28 |
| Battery | 9 |
| Caring | 7 |
| Mouse | 6 |
| Modem | 5 |
| Other | 4 |
| Hardrive | 4 |
| Keyboard | 3 |
Honoraria#
honor_df = (
    pd.read_csv(Path("../data/honorarium.csv") )
    .fillna("")
    .replace("Speaker (Expert talk)", "speaker")
    .replace("speaker for Open Data", "speaker")
    .replace("Speaker", "speaker")
    .replace("Mentor", "mentor")
    .replace("Call Facilitator", "facilitator")
    .replace("Call facilitator", "facilitator")
    .replace("Facilitator (co-hosted 2 meetings and Transcription of the three (3) graduation videos", "facilitator")
    .replace("Transcription of the videos, preparing guideline for the transcription", "facilitator")
    .replace("facilitator role (transcript check - week 2 and 3 cohort calls)", "facilitator")
    .replace("facilitator  (co-host a session )", "facilitator")
    .replace("facilitator (co-host a session)", "facilitator")
    .replace("Facilitator - transcription check", "facilitator")
    .replace("facilitator; transcription check", "facilitator")
    .replace("Video Facilitator", "facilitator")
    .replace("transcription check", "facilitator")
    .replace("Ally Skills workshop facilitator", "facilitator")
    .replace("Facilitator and Speaker", "speaker, facilitator")
    .replace("Mentor and expert", "mentor")
    .replace("co-facilitator, transcriber", "facilitator")
    .replace("Facilitator", "facilitator")
    .assign(
        Continent=lambda df: [get_continent(x) for x in df.Country],
        Rate=lambda df: [rate[x] for x in df.Currency],
        Role=lambda df: df.Role.str.title(),
    )
    .assign(Amount= lambda df: df.Amount * df.Rate)
    .drop(columns = ["Currency", "Rate"])
)
Amount#
Aggregating statistic of microgrant costs
honor_df.Amount.describe()
count    147.000000
mean     257.654042
std      129.356245
min       40.680000
25%      197.781300
50%      203.120000
75%      394.228300
max      772.090800
Name: Amount, dtype: float64
Total amount (in GBP)
sum(honor_df.Amount)
37875.1442
Cohort and role#
Number of honoraria
honor_cohort_role_nb_df = (
    honor_df
    .drop(columns = ["Continent", "Country"])
    .groupby(by=["Role","Cohort"])
    .count()
)
honor_cohort_role_nb_df = (
    pd.pivot_table(honor_cohort_role_nb_df, index = 'Role', columns = 'Cohort', values="Amount")
    .reindex(['Facilitator, Mentor', 'Mentor', 'Facilitator', 'Speaker', 'Speaker, Facilitator'])
)

fig, ax = plt.subplots()
fig.set_dpi(300)
(honor_cohort_role_nb_df
     .transpose()
     .plot.bar(stacked=True, ax=ax, colormap='tab20c'))
plt.xlabel("Cohort")
plt.ylabel("Number of honoraria")
ax.legend(fontsize='x-small')
<matplotlib.legend.Legend at 0x7fe7eb2dfb60>
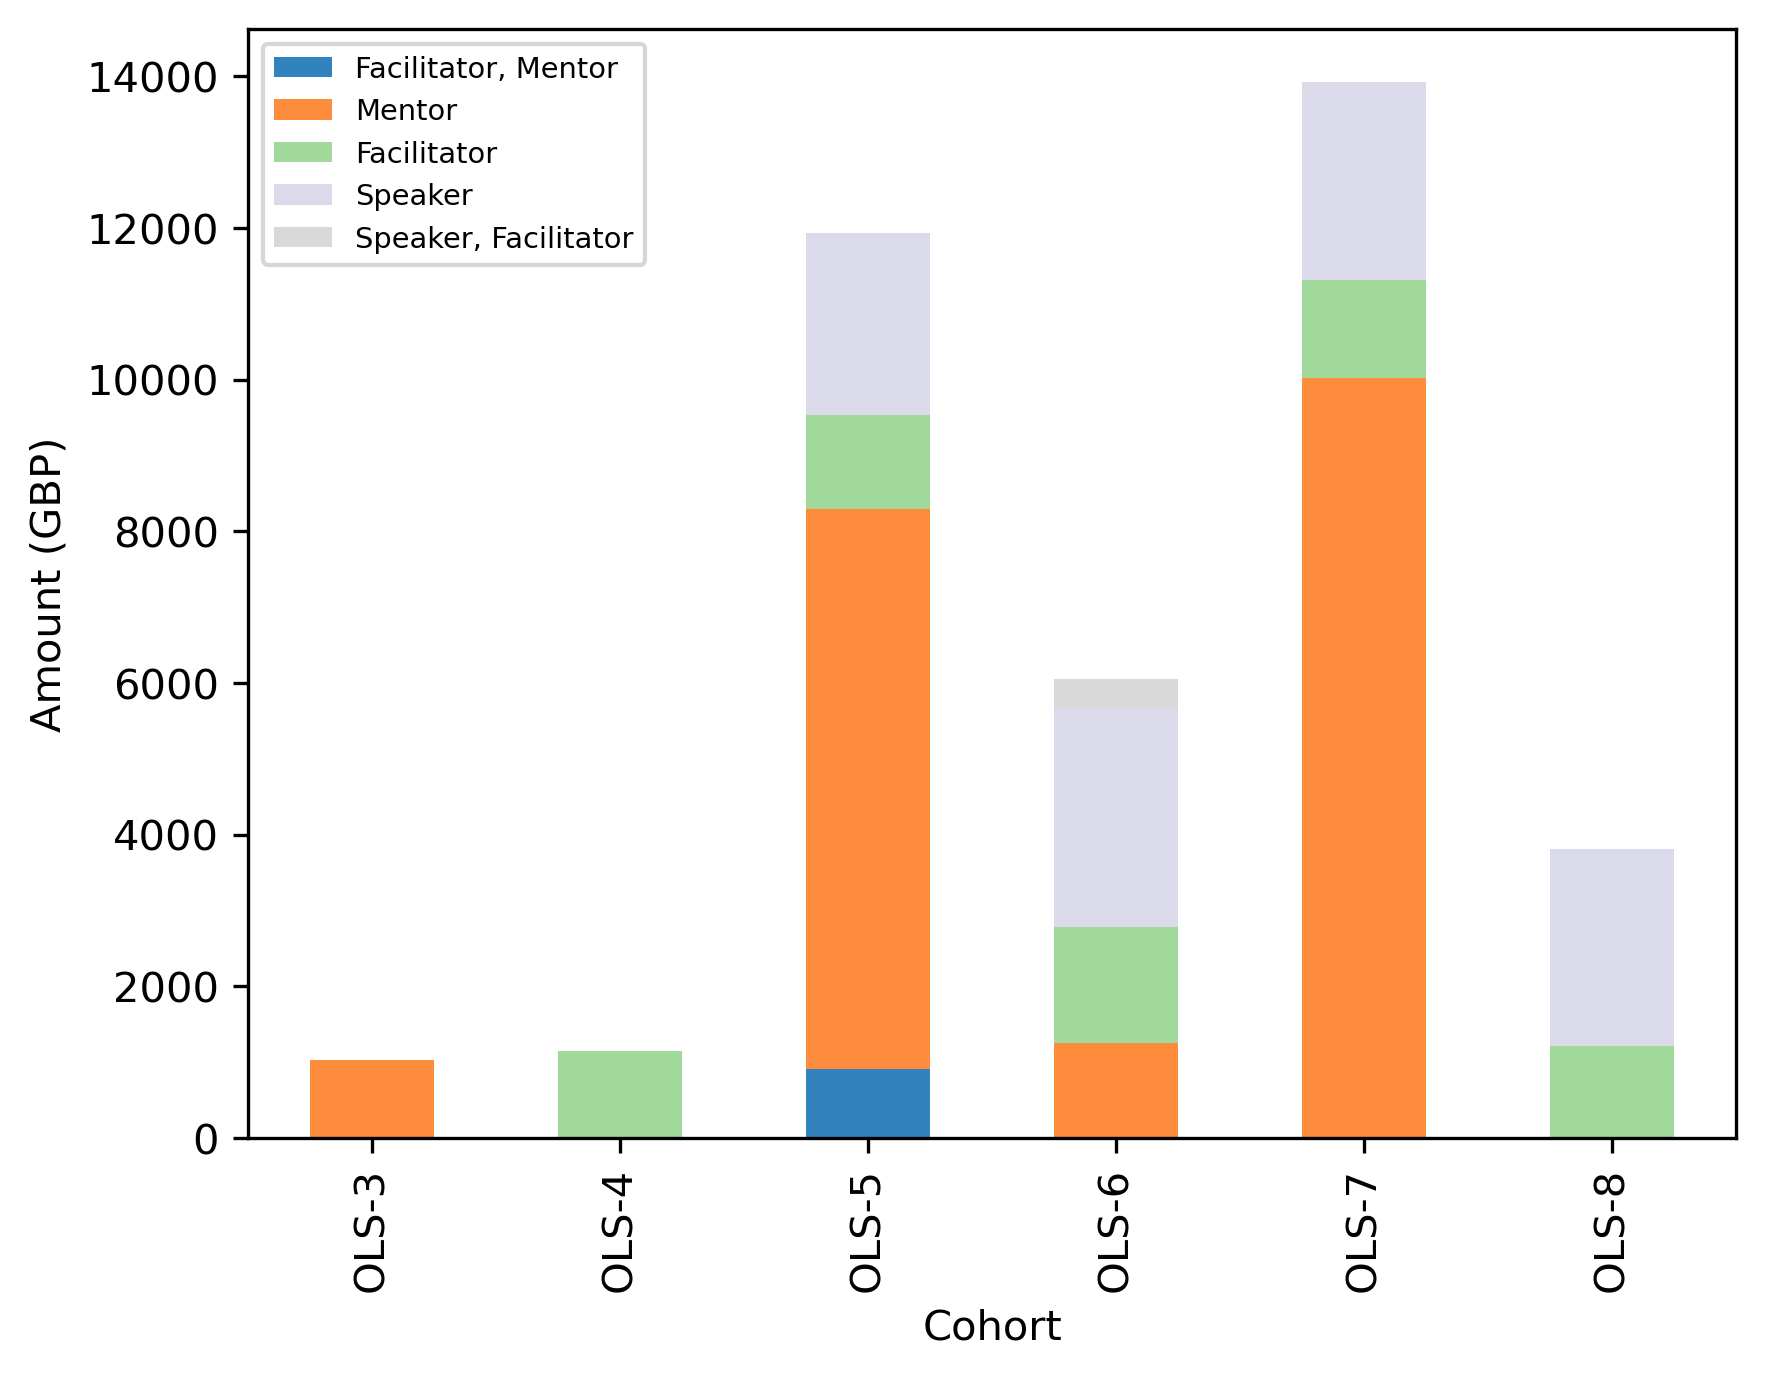
Amount (GBP)
honor_cohort_role_amount_df = (
    honor_df
    .drop(columns = ["Continent", "Country"])
    .groupby(by=["Role","Cohort"])
    .sum()
)
honor_cohort_role_amount_df = (
    pd.pivot_table(honor_cohort_role_amount_df, index = 'Role', columns = 'Cohort', values="Amount")
    .reindex(['Facilitator, Mentor', 'Mentor', 'Facilitator', 'Speaker', 'Speaker, Facilitator'])
)


fig, ax = plt.subplots()
fig.set_dpi(300)
(honor_cohort_role_amount_df
     .transpose()
     .plot.bar(stacked=True, ax=ax, colormap='tab20c'))
plt.xlabel('Cohort')
plt.ylabel('Amount (GBP)')
ax.legend(
#    loc='center left',
#    bbox_to_anchor=(1, 0.5),
#    frameon=False,
    fontsize='x-small')
<matplotlib.legend.Legend at 0x7fe82cc06ea0>
Overview figure#
fig, axs = plt.subplots(nrows=2, ncols=2, dpi=300)
fig.subplots_adjust(hspace=0.3)

#gs = fig.add_gridspec(2,2)
ax1 = axs[0, 0]
ax2 = axs[0, 1]#fig.add_subplot(gs[1, :])
ax3 = axs[1, 0]#fig.add_subplot(gs[2, 0])
ax4 = axs[1, 1]#fig.add_subplot(gs[2, 1])

# A
(microg_cohort_continent_nb_df
     .transpose()
     .plot.bar(stacked=True, ax=ax1, colormap="tab20c", figsize=(20, 10)))
plt.xlabel("Cohorts")
plt.ylabel("Number of microgrants")
ax1.legend(fontsize="x-small")
ax1.text(-0.15, 1, "A", transform=ax1.transAxes, size=20, weight='bold')

# B
(microg_cohort_continent_amount_df
     .transpose()
     .plot.bar(stacked=True, ax=ax2, colormap="tab20c", figsize=(20, 10)))
ax2.set_xlabel("Cohorts")
ax2.set_ylabel("Amount (GBP)")
ax2.legend(fontsize="x-small")
ax2.text(-0.15, 1, "B", transform=ax2.transAxes, size=20, weight='bold')

# c
(honor_cohort_role_nb_df
     .transpose()
     .plot.bar(stacked=True, ax=ax3, colormap='tab20c', figsize=(20, 10)))
ax3.set_xlabel("Cohort")
ax3.set_ylabel("Number of honoraria")
ax3.legend(fontsize='x-small')
ax3.text(-0.15, 1, "C", transform=ax3.transAxes, size=20, weight='bold')

# D
(honor_cohort_role_amount_df
     .transpose()
     .plot.bar(stacked=True, ax=ax4, colormap='tab20c', figsize=(20, 10)))
ax4.set_xlabel('Cohort')
ax4.set_ylabel('Amount (GBP)')
ax4.legend(fontsize='x-small')
ax4.text(-0.15, 1, "D", transform=ax4.transAxes, size=20, weight='bold')

#fig.tight_layout()
fig.savefig(Path("../figures/figure-4-microgrant-honoraria.png"), bbox_inches='tight')